Sub Prime Index Continues to Tumble
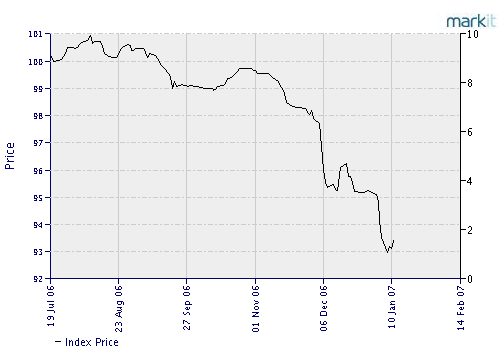 This graph shows the price movement of an index that consists of pools of sub-prime mortages. What is essentially shows is that the market for sub-prime mortages expects a higher rate of defaults. (The lower the price of the index, the less probability 100% of the principal of the mortages will be collected.) If you want a good read as to why this is an ominous sign for the housing market, then read this.
posted by Little_Silvered at 6:57 PM
![]()
![]()


0 Comments:
Post a Comment
<< Home